|
|
Oregon Phenomena |
If you have an idea for a phenomenon to include here, contact us! Phenomena by Region
Phenomena by Topic
May 2019: Sea Lions vs SalmonDeveloped by Natalie Wolf - Elementary school teacher OverviewSalmon are a crucial part of the Columbia and Willamette Rivers ecosystems. They are also vital to many tribal communities, including Yakama, Umatilla, Warm Springs, Grand Ronde, Nez Perce and Siletz, and important to recreational and commercial fisherman. In the last few years, sea lions have been traveling from the Pacific to feed on the migrating salmon and other fish. They are traveling long distances to the Bonneville Dam and Willamette Falls to feast on the migrating salmon that are slowed by these barriers. Scientists study the rates of migration and numbers of sea lions and have been trying various methods of discouraging the sea lions from eating the salmon. Sea lions have eaten tens of thousands of fish in these areas and are eating endangered fish potentially to extinction. Recently, Oregon was granted legal permission to lethally remove sea lions in an effort to protect the fish. This lesson starts with students being challenged to think like scientists and develop a solution to a given problem based on information. The explanation of the phenomenon comes at the end as they learn that this is a real-life scenario that is playing out in their own communities. Discussion on this scientific phenomenon could also offer entry points into conversations around economics, government, and Oregon’s tribal communities, cultures, and history. GRADE LEVEL: 5 (modifications could be made to adjust to a 3rd or 4th grade lesson but would require more teacher support with the text and notes and more of a focus on life cycles and ecosystem dynamics) Time: 1 hour INTRODUCING and EXPLORING THE ANCHORING PHENOMENON1. Begin class by reading through the challenge with your students. You can show pictures of the Bonneville Dam and Willamette Falls to help them get a sense of the structure and location. Locate them on a map.
2. Using the attached sheet, have students work in teams to read about the problem and make notes about the sea lions, salmon and scientists. While not included in the Army Corp of Engineers’ article, encourage students to also think about how this issue impacts fishermen (recreational and commercial), as well as local tribal communities (Umatilla, Nez Perce, Warm Springs, Grand Ronde, Siletz and Yakama). https://usace.contentdm.oclc.org/utils/getfile/collection/p16021coll3/id/750 3. Support students in the reading and interpreting of the graphs. What do you see? Help students draw connections between the increase in sea lions with the increase in salmon consumed compared to the previous 10 years. (Graphs from Army Corps of Engineers study cited on Northwest Power and Conservation Council https://www.nwcouncil.org/news/going-going-almost-gone) 4. Come back together to compare answers and discuss each of the differing perspectives. Questions to consider:
5. Using the attached planning page, have teams or pairs of students clearly identify the challenge and come up with 3 possible solutions. Come back together as a class and have teams briefly share out a few ideas, developing a class list of proposed ideas. Then give teams time to choose one idea and analyze potential benefits and impacts of their proposed idea. Students should consider how their solution impacts or benefits each part of the scenario. 6. Briefly have teams present their ideas to the class. Click here to view the rest of the phenomenon, including standards connections and student sheets!
April 2019: Eagle Cap Extreme Dog Sled RacesDeveloped by Donna Rainboth – GO STEM Program Coordinator Overview
Grade Level: 3-6NGSS Performance Expectation:
NGSS Science and Engineering Practices: Planning and Carrying Out Investigations, Developing and Using Models NGSS Disciplinary Core Idea: Forces and Interactions NGSS Crosscutting Concepts: Cause and Effect Engineering Design
Introducing the Anchoring Phenomenon
Exploring the PhenomenonRamps and Force Investigation Essential Question: How does the amount of force needed to move a block of wood up a ramp change as the surface of the block changes? Materials (for each student group)
Procedures
Engineering Design LessonProblem to Address: Mushers need a sled that moves smoothly over the snow and can be pulled up an incline with the least amount of force needed. The mushers would like to see examples of different types of runners and how they affect the force needed to move a model sled. Criteria
Constraints
Materials
Procedures for Engineering Design Exploration
Click here to read the rest of the unit plan
Since 2014, sightings of unusually high densities of pink, gelatinous, tube-like sea life have been reported off the Oregon coast, washing up on beaches and clogging fishing gear (Sorenson, 2017). Marine scientists are trying to understand the reasons for their sudden appearance. Could climate change be responsible? GRADE LEVEL: 9 - 12 NGSS Disciplinary Core Ideas: LS1.A: Structure and Function; LS2.A: Interdependent Relationships in Ecosystems; LS2.C: Ecosystem Dynamics, Functioning, and Resilience; ESS2.D: Weather and Climate; ESS3.D: Global Climate Change. NGSS Cross Cutting Concepts: Cause and Effect; Systems and System Models; Stability and Change; Structure and Function; Patterns. NGSS Science and Engineering Practices: Asking Questions and Defining Problems; Analyzing and Interpreting Data; Constructing Explanations and Designing Solutions; Engaging in Argument from Evidence; Obtaining, Evaluating, and Communicating Information.
INTRODUCING THE ANCHORING PHENOMENON 1. Begin class by sharing the two photos above without photo captions. (Photo credits: Brodeur, et al., 2018.) 2. Ask: Has anyone ever seen or heard of these? If so, encourage students to explain where and when they have observed them. 3. Depending on answers, explain/confirm that students are looking at photos of what are called pyrosomes (Pyrosoma atlanticum) taken along the Oregon coast in 2017. 4. Follow up this discussion by sharing the NOAA video footage of pyrosomes taken 85 miles off of Newport, Oregon to a depth of 100 meters. While watching, challenge students to record at least two observations about pyrosomes that could help them understand how they move or what they might eat and one question they now have about pyrosomes. https://youtu.be/9ovWa83GIOo 5. Create a class list of observations and questions about pyrosomes. EXPLORING THE ANCHORING PHENOMENON The appearance of such high densities of a normally tropical sea life in the much colder Pacific has created many questions for marine scientists. 1. Share the four-minute video link below and challenge students to individually listen and record at least three questions marine scientists are now pursuing as a result of the unusual pyrosome sightings. https://www.youtube.com/watch?time_continue=3&v=YLFbQpkrsBY 2. Split students into groups of three and complete a round robin where each student shares one of the questions they listed. As a whole class, record one research question from each group. Possible examples:
EXPLAINING THE ANCHORING PHENOMENON
1. Share with students possible explanations being examined by marine scientists for the high density pyrosome sightings on the Oregon coast:
2. Using the Oregon STEM partners, research articles, and resources listed below, challenge student teams to research which claim the scientific data most supports. Each team will share their conclusions using the Claims, Evidence, and Reasoning strategy. Teams should also prepare a rebuttal that explains why the unselected or alternative claims are not the best descriptions for the pyrosome phenomena. CLAIMS, EVIDENCE, REASONING AND REBUTTAL STRATEGY Make a Claim: A statement that identifies which anchoring phenomena explanation the team agrees is most consistent with the scientific evidence. Provide Evidence: Sufficient, appropriate, qualitative and/or quantitative evidence that supports their claim. Share Reasoning: Explain how or why the data counts as evidence to support their claim, provide a justification for why this evidence is important to their claim, and include one or more scientific principles that are important to their claim and evidence. Image Credit: Digital Chalkboard SUPPORTING RESOURCES OREGON PARTNER CONTACTS: Cooperative Institute for Marine Resource Studies P: 541-867-0404 Dr. Kim Bernard, Assistant Professor College of Earth, Ocean, and Atmospheric Sciences Oregon State University Corvallis, Oregon P: 541-737-9337 ARTICLES: Brodeur, R., Perry, I., Boldt, J., Flostrand, L., Galbraith, King, J., M., Murphy, J., Sakuma, K., and Thompson, A. (2018). An unusual gelatinous plankton event in the NE Pacific: The great Pyrosome bloom of 2017. PICES Press, 26(1), 21-27. https://www.researchgate.net/publication/322665037_An_unusual_gelatinous_plankton_event_in_the_NE_Pacific_The_Great_Pyrosome_Bloom_of_2017 Sutherland, K. R., H. L. Sorensen, O. N. Blondheim, R. D. Brodeur, A. Galloway. In press. Range expansion of tropical pyrosomes in the northeast Pacific Ocean. Ecology. 0(0), pp. 1-3. Oregon Field Guide Northwest Fisheries Science Center https://www.nwfsc.noaa.gov/news/features/pyrosomes/ https://www.nwfsc.noaa.gov/news/blogs/display_blogentry.cfm?blogid=1&month=06&year=2017#blogentry126 National Geographic https://news.nationalgeographic.com/2017/06/pyrosome-fire-body-bloom-eastern-pacific-warm-water/ CLIMATE CHANGE RESOURCES: NASA Global Temperature Visualizer https://climate.nasa.gov/interactives/climate-time-machine Authors: Lisa M. Blank, Tracy Crews, Nancy Steinberg, Elizabeth Daley, Kama Almasi |


 Eastern Oregon consistently receives significant snowfall during the winter months. One event that takes advantage of this weather phenomena is the Eagle Cap Extreme Sled Dog Race in Wallowa County. This is Oregon’s only Iditarod and Yukon Quest qualifier. Mushers come from all around the west to participate in the races. Students throughout eastern Oregon visit Joseph, Oregon during the January event to meet the dogs, converse with the mushers and observe the gear used during the race, particularly the dog sleds.


 How can this local, seasonal phenomenon be a jumping off point for students? Here, we use the Crosscutting Concepts as a lens to ask different kinds of questions about the phenomenon of mushroom growth (linked articles are to provide more information to get the wheels turning...). Note: some of these questions are investigable by students, and some are still unanswered by science!

| K-2 | 3-5 | 6-8 | 9-12 |
| Objects can be seen only when light is available to illuminate them. Some objects give off their own light. (1-PS4-2) Some materials allow light to pass through them, others allow only some light through and others block all the light and create a dark shadow on any surface beyond them, where the light cannot reach. Mirrors can be used to redirect a light beam. (Boundary: The idea that light travels from place to place is developed through experiences with light sources, mirrors, and shadows, but no attempt is made to discuss the speed of light.) (1- PS4-3) |
An object can be seen when light reflected from its surface enters the eyes. (4-PS4-2) | When light shines on an object, it is reflected, absorbed, or transmitted through the object, depending on the object’s material and the frequency (color) of the light. (MS-PS4-2) The path that light travels can be traced as straight lines, except at surfaces between different transparent materials (e.g., air and water, air and glass) where the light path bends. (MS-PS4-2) A wave model of light is useful for explaining brightness, color, and the frequency-dependent bending of light at a surface between media. (MS-PS4-2) However, because light can travel through space, it cannot be a matter wave, like sound or water waves. (MS-PS4-2) |
Electromagnetic radiation (e.g., radio, microwaves, light) can be modeled as a wave of changing electric and magnetic fields or as particles called photons. The wave model is useful for explaining many features of electromagnetic radiation, and the particle model explains other features. (HS-PS4-3) When light or longer wavelength electromagnetic radiation is absorbed in matter, it is generally converted into thermal energy (heat). Shorter wavelength electromagnetic radiation (ultraviolet, X-rays, gamma rays) can ionize atoms and cause damage to living cells.(HS-PS4-4) Photovoltaic materials emit electrons when they absorb light of a high enough frequency. (HS-PS4-5) Atoms of each element emit and absorb characteristic frequencies of light. These characteristics allow identification of the presence of an element, even in microscopic quantities. (secondary to HS-ESS1-2) |
How have your students demonstrated their understanding of light waves? Tweet at us: https://twitter.com/ORSciTchr
 August 2018: URBAN HEAT ISLANDS
Phew! July was HOT. With the exception of the Oregon Coast, Oregonians have been on the hunt for the coolest places to spend the day. This month's phenomenon, urban heat islands, is inspired by the heat wave many of us experienced in July, and involving students in planning climate resilient communities.

Data shows that temperatures are increasing faster in urban areas than in surrounding rural areas, which has the potential to negatively impact human health. In fact, Portland has the fourth highest heat island effect (meaning the difference between Portland temperatures and surrounding rural areas is greater than most cities). The PDX Resiliency app takes localized climate data one step further and assesses the city of Portland by temperature, access to air conditioning, local air quality and more, highlighting who might be most vulnerable to rising temperatures and where to focus mitigation efforts.
Most of Oregon is not urban - are there localized heat island effects that can be detected in rural areas, too?
One way to help students better understand heat islands is to study microclimates on the schoolyard. Annenberg Learner's Journey North website provides lessons that are centered around planting a pollinator garden in the part of the schoolyard that is most similar to the local climate. Students map the schoolyard and take temperature data at different locations over a period of time. With the data students have taken, they can then propose design solutions to cool the schoolyard on hot days. (These activities would align well to the NGSS third grade Weather and Climate standards)What other Disciplinary Core Ideas would students need to know to understand the phenomenon of urban heat islands? How do heat waves impact your community?
JULY 2018: KEYSTONE SPECIES IN OREGON'S KELP FORESTS
This month's phenomenon is pulled from Diving Into Oregon's Kelp Forests, a 6-8th grade curriculum from the Coast Aquarium. Diving Into Oregon's Kelp Forests takes a closer look at kelp ecosystems off the coast of Oregon, including the keystone species that keep the ecosystem healthy and diverse. Interested in this topic? The Coast Aquarium is hosting a professional development day on August 3!
From the curriculum:


Compare these two sites. Which site has a greater abundance of species? Which site has a greater diversity of species? Which site appears to have a healthier ecosystem? Why?
To take a "deeper dive" into the idea of keystone species and how they affect Pacific coast ecosystems, view this video (also linked in the curriculum).
After viewing the video, these questions might come to mind: What ecosystems are in my area? What are the keystone species there? How could students explore the effects of absent keystone species? How could students design plans to reintroduce keystone species?
Already engaged in learning like this with your students? We'd love to hear about it. Tweet at us or email us!
june 2018: LIVING WITH ACTIVE VOLCANOES
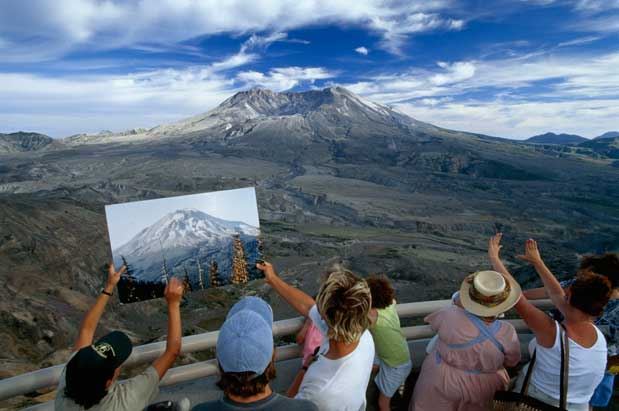
Mt. St. Helens, one of the most active volcanoes in the Pacific Northwest, with a viewer holding a photo of its pre-1980 eruption profile. Photo by Jim Richardson
Aloha from Hawai'i! Leah, the editor of TOST, has the incredible fortune of writing this month's newsletter from the north shore of O'ahu. The eruption of Kīlauea on the island of Hawai'i has many of us thinking about the hazards of living around active volcanoes. Although Kīlauea's activity is unrelated to the volcanic activity in the Northwest (the Associated Press initially erroneously named Hawai'i as part of the Ring of Fire - see correction in the linked article. Whoops!), it is a good reminder to consider the natural hazards we live with every day.
In considering the phenomenon of living with active volcanoes, this sample NGSS unit asks the question: Why do people live and farm on volcanoes? This resource gives an overview of a possible middle school curriculum for the year, with an example of "bundling" Performance Expectations to provide a conceptual flow. This example of bundling PEs could be modified to address living with other geologic hazards, such as a flood plain.
Not a middle school teacher but interested in learning more about NGSS standards related to natural hazards? NSTA has a page outlining ESS3.B: Natural Hazards. Discover your grade band's disciplinary core idea(s) and how they fit into the overall progression of learning.
The Oregon Department of Geology and Mineral Industries (DOGAMI) has a page dedicated to natural hazards in Oregon, such as earthquakes, floods, landslides and tsunamis. What natural hazards exist in your area? How does your community prepare?
MAY 2018: MONARCH BUTTERFLY MIGRATION
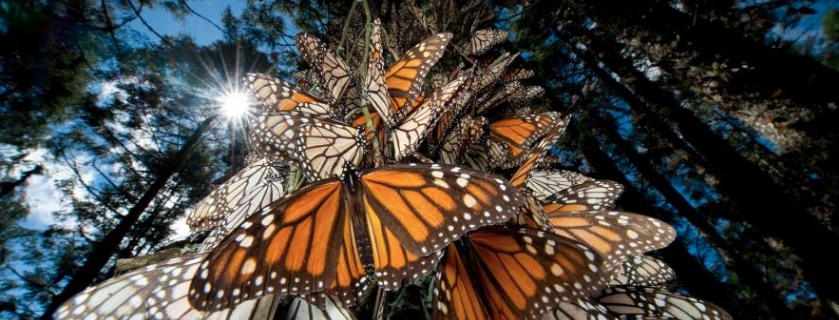
This spring and summer, eastern Oregonians are in for a treat: Monarch butterflies make their incredible migration north after overwintering in California. Below are some ideas of how to experience this phenomenon with your students.
- Learn more about monarch migrations in this National Geographic article.
- In Sisters, students will be participating in their annual Western Monarch and Pollinator Spring Migration Celebration on May 5th (click here for more information). A teacher from Sisters Middle School wrote a book about the monarch butterfly migration with her students, based on a real butterfly's migration. Read more about it here.
 Students all over Oregon can look for monarchs and participate in the Journey North citizen science project. Students can also look for patterns in previously reported data to make predictions about when monarchs might be seen in their area.
 - Participate in the Monarch Larva Monitoring Program through the University of Minnesota. Are you in an area with regular monarch visitors? Register to have your school become a monitoring site!
- This article from the Statesman Journal contains information about how to increase the likelihood that you will see monarchs in your schoolyard or backyard. Can your students design a solution to the problem of declining monarch butterflies?
April 2018: OREGON SNOWPACK
Consider the difference between these two Snow Water Equivalent maps from January 30 and March 29 :


Click here for an interactive comparison (credit to the Statesman Journal for the idea)
How is your area affected? How do scientists decide what snowpack levels are "normal"? Why is it important to study snowpack, anyway? Here are some more recently published articles about this phenomenon that might spark some ideas:
To find the SNOTEL maps used above and more interactive data about weather and climate, explore the National Resources Conservation Service (NRCS) website for Oregon.
The Oregon Basin Report from USDA/NRCS contains region-specific information about water conditions in Oregon. Contained in this report are streamflow forecasts, graphs comparing the current snowpack with historical snowpack, and data tables galore.
MARCH 2018: THE FLOATING PAPERCLIP AND GENERATING INVESTIGABLE QUESTIONS
When you drop a paperclip into a cup of water, it sinks. But wait! Is there a way to make it float on the surface of the water? Observe here: https://www.youtube.com/watch?time_continue=2&v=fz4jn3h_9VU
Try recreating this phenomenon yourself! It's surprisingly fun considering how simple it is. Engaging with the paperclip phenomenon is a perfect opportunity to practice the process of asking investigable questions. This resource, adapted from The Exploratorium in San Francisco, can guide you through the process.
FEBRUARY 2018: ENGINEERING A TIPI
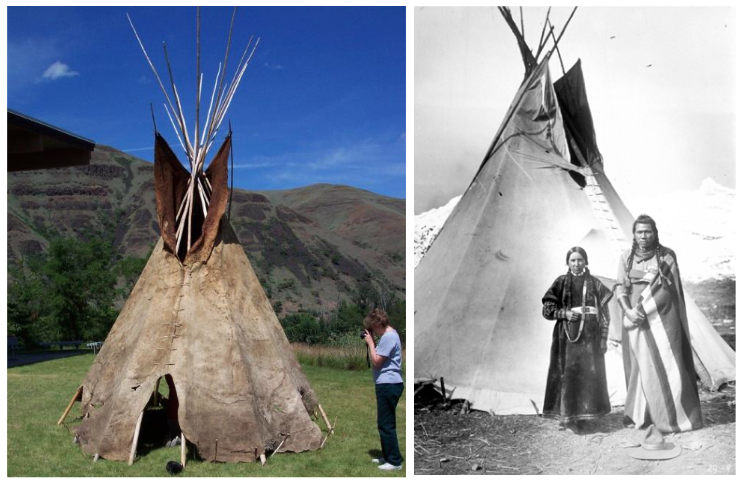
For this month's phenomenon, we're focusing on an engineering challenge: Using the photos, diagrams, and materials, try your best to construct a tipi model.
The following tipi modeling and measurement high school curriculum materials were designed by C Greene. These resources are shared with her permission. We hope they spark ideas for how to plan culturally relevant science, mathematics and engineering units.
Tipi Powerpoint; Tipi Unit Plan; Student Handout
For younger students
Teepee, Sun and Time: This children's story, written by Henry Real Bird, explains tipi (teepee) building, including embedded mathematical and cultural knowledge.
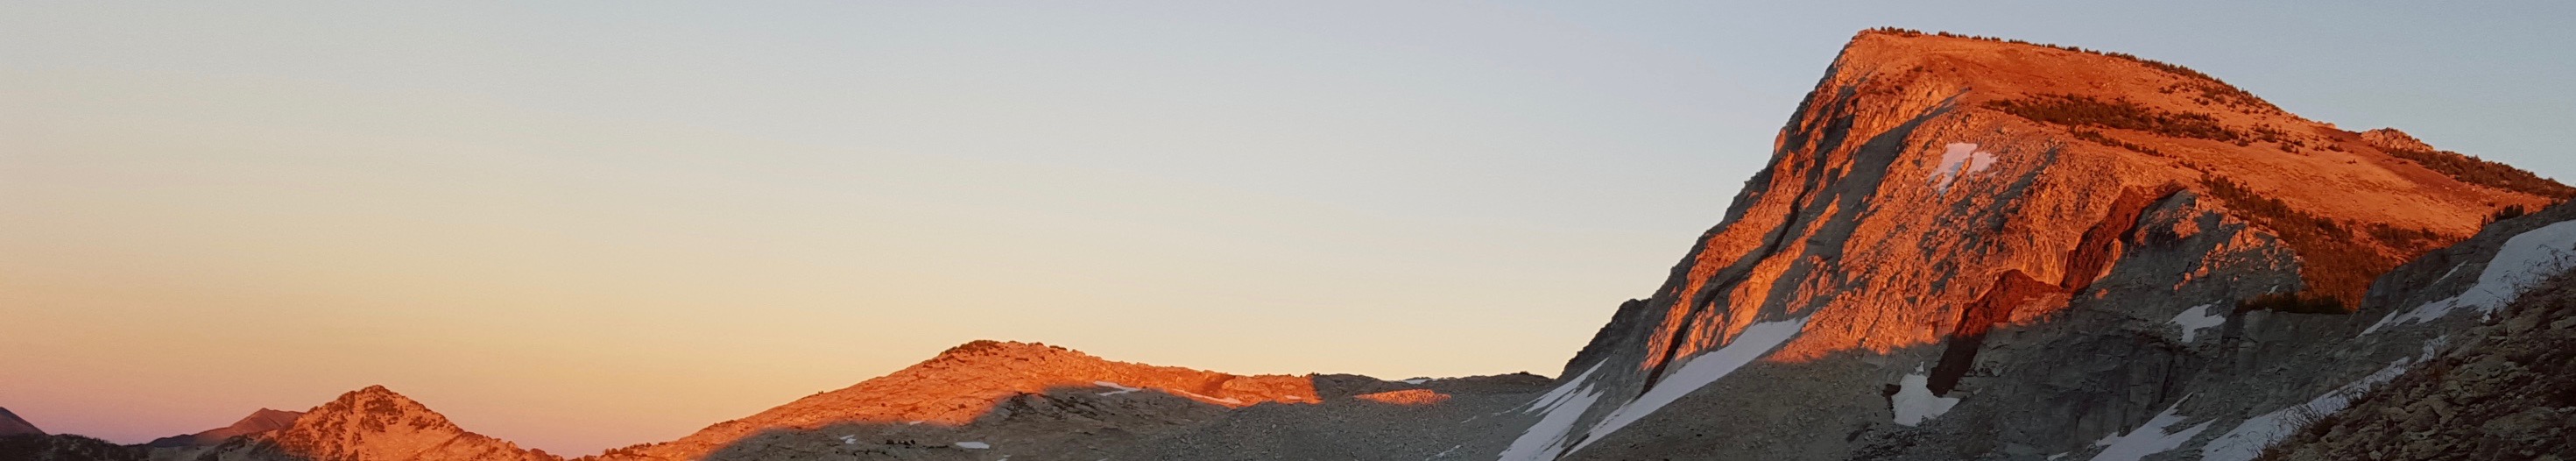
JANUARY 2018: THE GEOLOGY OF THE WALLOWAS (Nez Perce name: Waĺwá⠂max̣s)
How could the geology unit described in the above middle school professional learning article be tailored to feature a more local Oregon phenomenon?
Consider the image below:
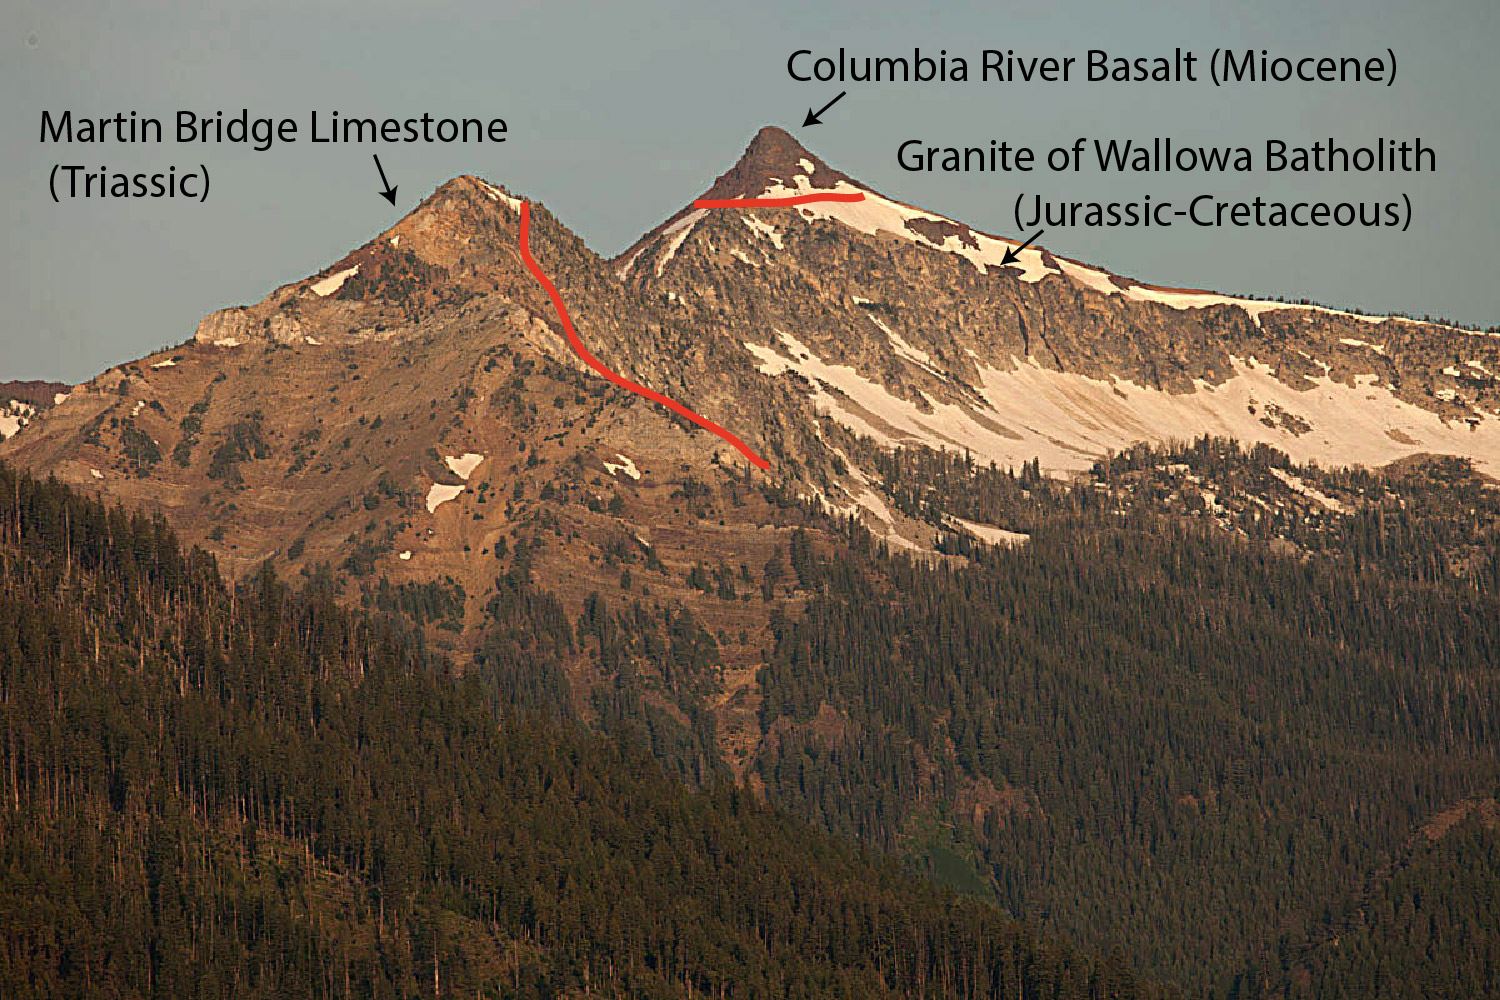
Photo and annotations by Marli Miller
More information about the Wallowa Mountains and Oregon's geological history:
- Geology of the Wallowa Mountains - geological map of the Wallowas.
- Geologic History of Oregon - the story of how Oregon was formed, complete with a geologic timeline, diagrams, photos and real-life examples.
- The Geology of Part of the Wallowa Mountains and Geology and Physiography of the Northern Wallowa Mountains - these USGS bulletins summarize geological surveys of the Wallowas, including a geologic history and photos of fossils and landforms.
- Geology Pics - free to download for educators, and searchable by feature. Find your local geological phenomenon!
- History of the Wallowa Nez Perce - information about the traditional way of life and people of the Wallowa mountains and surrounding land.
DECEMBER 2017: GRAY WHALE MIGRATION
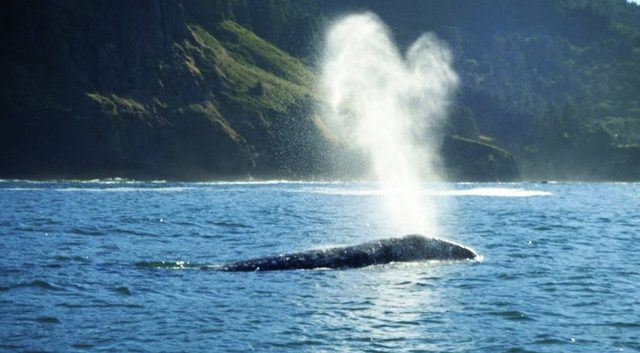
Gray whales can be observed migrating along the Oregon Coast every winter and spring. Educators: what questions might students ask while observing this phenomenon? How might they investigate this phenomenon through different Crosscutting Concept lenses, like Energy and Matter, Patterns, Structure and Function, or Systems and System Models? Which Science and Engineering Practices could be the most useful tools to answer questions?
The following links contain more information about gray whale migrations:
Annenberg Learner - includes interactive migration map, migration field notes and gray whale information
Oregon State Parks - find out where to observe gray whales along the Oregon Coast, as well as data collected in previous years
Whale Watching Spoken Here - sign up to volunteer for the 2017 Whale Watching Week December 27-31
Drone footage of gray whales - start honing your whale spotting skills now!